Infographics can help you quickly present visual information such as data, facts, and knowledge. If you are not a professional graphic designer, creating a beautiful and effective infographic for your virtual event seems like a daunting task.
So, if you want to design infographics for your virtual event, you have come to the right place. Follow our beginner infographic designing tips below to learn how to make your infographic.
We will cover 10 basic tips you should know to ensure the infographics you create are both rich and beautiful.
Let’s get started!
1. Always Start by Outlining your Goals for Creating an Infographic
Your goal for creating infographics can vary based on the kind of business. Infographics can be used to:
Provide a quick overview of your project
If you are representing a new concept that is difficult to understand, outlining the steps for a project, or you want to introduce a new policy, using infographics to summarize information can eliminate a lot of confusion.
Explain and simplify a complex process
Any new concept that you want to introduce into your business can cause a lot of confusion.
To make the concept easily understandable, try to create a process infographic that your audience or customers can use as a reference.
Display research results or survey data
Infographics are the perfect way to share survey data because they allow you to tell stories with data.
This is especially convenient if you want to share your survey data on social media, blog posts, or white papers. Infographics have the potential for creating more engagement and shares, particularly on social media.
Summarize a long blog post or report
When you have a long blog post or report, it is helpful to summarize the key points in an infographic. This allows readers to easily browse the most important information.
There is no need to answer the same questions after the report is issued. Your readers can easily grab any important information that they would miss otherwise.
Compare and contrast multiple options
How do you make a decision when there are two good choices? Write down the advantages and disadvantages of each method.
Comparison infographics are a visual way to compare products, plans, arguments, and ideas.
Raise awareness of the problem or cause
Using your social channels to build awareness is essential for many organizations. Infographics have the power to help you tell stories and raise awareness of the problem or cause.
2. Your Data Should Tell the Story
With the data, visualization, and creative images, an infographic tells a story. It plays a critical role particularly during recent times when the attention span of people is rapidly decreasing.
An infographic tells a clear and quick story. It makes the data understandable and condenses a vast amount of data into images that are catchy and memorable.
If the infographic catches the attention of the reader, you win. Just make sure the data comes from a reliable source. The data should not be controversial and it should encourage healthy discussion and help you expand your business.
3. Keep Your Audience in Mind
Creating an eye-catching graphic is great, but you have to keep in mind your audience particularly if you designing one for your virtual event.
If you are creating an infographic for your students, you should include more images that are easily catchy, appealing, & engaging. However, if you are designing a graphic for your office team members you can add more graphs, and charts.
You can create amazing charts and graphics using Visme’s chart maker and graph maker include them in your infographic. Given a topic and a set of data to work on, it is easy to fill your mind with good ideas about your narrative and visual effects-but the first step should be to ask yourself, who will you talk to?
Ask yourself how to add valuable information to the busy life of readers? And, once your readers reach the bottom line of your infographic, what do you want them to leave thinking or do?
Knowing your audience should be the primary factor in guiding and determining the purpose of the infographics you want to create.
You need to study the customer, market, and media landscape to identify areas of opportunity to connect with a predetermined recipient audience.
Once you identify your audience, it’s time to determine the purpose and customize the infographic call-to-action.

4. How to Build a Compelling Narrative
When building a narrative around data, remember: it’s not the size of the numbers, but how you use them.
Your narrative is as good as your ability to resonate with your readers, so remember who they are, what beliefs they hold about your topic, what they already know, where they read your infographic.
Considering the perspectives of your readers, and knowing that there may be hundreds of other contents on their radar, identify how much content they can digest in the first few minutes.
The magic of data is that it can show us trends and patterns. Ultimately, the goal of your narrative is to put the patterns at the right angle.
5. Learn How to Make Complex Ideas Easy to Understand
Once you analyze your data and know the story you want to tell, you need to start thinking about ways to present the data visually.
Ultimately, the main purpose of your infographics is to make the data understandable to a wide audience without spending too much time on complex ideas.
Visuals can help viewers understand the topic easier than a spreadsheet or a paragraph of text.
Your graphics should aim to free the data from the constraints of the table and present it in a format that can reveal hidden trends, highlight key points, and look great.
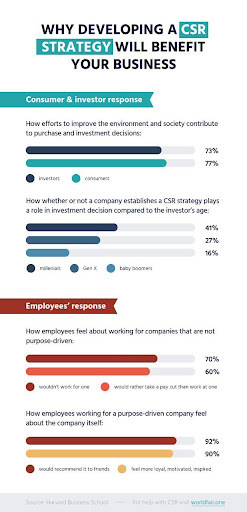
Infographics from https://worldfair.one/)
6. Data Visualization for Your Infographic
When you collect all the data for creating your infographic, the next step is deciding how to present that data visually.
For your convenience, you can use a chart maker to create appealing charts for your data.
You need to determine your primary goal for all the data you have collected whether it is to:
- Inform
- Compare
- Change
- Organize
- Reveal relationships
- Explore
Let’s review for each goal:
Inform
You want to convey essential information or data points that do not require many contexts to understand.
Compare
You can highlight similarities or differences between different subjects.
Change
Your goal might be to show trends over time or space.
Organize
You want to display the group, mode, rank, or order.
Relationship
You want to reveal more complex relationships between things.
Explore
Your goal is to help readers explore the data and discover insights on their own.
The visualization style always depends on the specifics of your data.
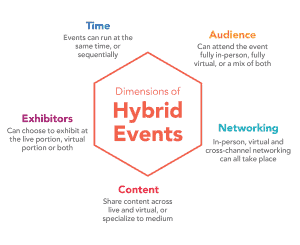
Infographic by vFairs
7. Choose the Right Tools
Data designers can use a variety of different charts. When creating infographics, pie charts, bar charts, line charts, area charts, and other such chart types are part of its preferred toolkit.
Knowing when to use a specific chart is important because they are not always interchangeable. Just make sure to present the data in the most understandable form, which usually depends on how the data is organized and classified.
It may be tempting to choose a chart based on shape rather than function, but when trying to represent information visually, ease of communication should always emphasize visual design choices.
If a bar chart displays data in its most accessible format, don’t be afraid to use a bar chart.
These commonly used charts provide some of the most effective ways to accurately display data, and they usually form the basis of some of the most beautiful visualizations. They can be adjusted and utilized in many unique ways while still providing value.
8. Choose the Right Visual Method for Designing Infographics
In the visual design of infographics, there are often two clear methods.
On one hand, you have the people who let the data speak. They combine colors, shapes, and clean typography to create amazing works of art from the data itself, while the narrative is expressed entirely through the presentation of the data.
On the other hand, some people use illustrations and clever visual metaphors to help drive the narrative and guide the viewer through the data.
Both (or even a combination of the two) can create amazing results, but the approach you take is usually determined by the following factors:
- Audience
- Expected tone
- Purpose
- Moderate
Illustrations help to express the narrative you want visually, but they should be used with caution.
Data and information should still be the protagonists of the program, and descriptive elements should not hinder the viewer’s understanding or obstruct the data in any way.
If used properly, the metaphorical visual representation of data is both influential and insightful.
9. Distribution Process and the PR
Once the graphic is created, it can be distributed to the general public. The truth is that you can create the most gorgeous and insightful infographic in the world’s history, but if you don’t have a distribution plan from the beginning, no one will see it.
The obvious first step in distribution should be sharing via social media. As we all know, there are organic methods and paid methods for social media distribution, and it is important to use both.
Next, it’s important to determine exactly which sites your readers spend time on and which sites they read in their free time.
Once you have identified these places online, please contact these sites and tell them why your infographic adds value to their readers.
In addition to this, consider distributing your infographic over organic, transactional channels. For instance, you could make an email signature with a link to your infographic and this would reach everyone you talk to. This way, you could bring about more exposure to your content without additional resources.

10. Use Grid Layout for Infographics
If building a layout from scratch seems too daunting for a naïve beginner like you, you can use ready-made infographic templates that you can personalize to suit your data.
The trick is to choose a method that suits your content. The best way is to temporarily forget about colors, styles, and chart types. First, choose an infographic template based on its structure, and then use its style.
Conclusion
Adding virtual events as a key digital strategy to your virtual meetings and events is a good idea. But the fact is, a virtual event does not have the same power of interactions we have while interacting face-to-face.
An infographic is a good alternative in which you have full confidence and trust for delivering an engaging and informative experience to your clients and colleagues.